|
|
|
Categories
|
|
Information
|
|
Featured Product
|
|
|
 |
|
|
There are currently no product reviews.
 ;
The manual was properly scanned and perfectly readable. The only small problem is that I couldn't use my dear Ctrl + F to find a word I needed.
;
Nothing wrong with the manual or the delivery - came to me the same day I ordered it. But afterwards I realized that I ordered the wrong manual. Probably better with the Quick start - version. So maybe it would be better if we could see a list with inhold for each manual before ordering?
 ;
Bought T4850 High End Tuner a few years ago, but i didn't know where all the buttons were used for. So i purchased the owners manual. Perfect! Just what i needed.
;
Bought the used Philips car-radio. No manual! Found on this site a copy of the orginal English manual. I am very happy with it. Now I know how to setup and use my "new" car-radio.
Recommended site for everybody looking for a manual for (older) products!
;
Great deal, you are the only one on earth who could deliver this old manual. Thx so much and have nice chrismas
Each of the following tracks produces a low-frequency test tone. The range of these tests is from 100Hz down to 20Hz.The frequency of each test is announced before it begins.The first test is the highest frequency (100Hz); therefore, you will be marking the template from right to left. Each frequency point is listed across the bottom of the Measurement Template (this is
w
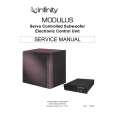
When finished, press Skip to advance to the next test. Repeat the process described above for Tracks 5 through 26. When you have completed the 23 measurements, you are ready to analyze the data and make corrective adjustments.The completed Measurement template will look something like the example in Figure 18. Completed R.A.B.O.S. template
w
called the X-axis). See Figure 15 on the previous page.The vertical scale on the left side of the template indicates relative level, in dBs (the Y-axis).The template�s vertical scale matches that of the RSLM bar graph. Cue Track 4 and Pause II. From now on, you will want to keep your CD player�s remote control handy. Press Play . As Track 4 plays, observe the level indicated on the RSLM. EXAMPLE:The test frequency is 100Hz and the level indicated is -2dB. Find the intersection of 100Hz (X-axis) and -2dB (Y-axis). Place a dot at that point. See Figure 16.
Locating a test point
FIGURE 18
Now connect the dots as shown in Figure 19. This will make interpretation of the data much easier.
FIGURE 16
It takes a few seconds for the RSLM reading to stabilize, especially at very low frequencies. Don�t rush. Give each test adequate time for the meter to stabilize. At the bottom of the bar graph is a green �ON� LED.This LED is illuminated whenever the sound level is below the measuring range of the RSLM. If this occurs during a test, place a dot at the intersection of the test frequency and the bottom frame of the template. See Figure 17.
Test example with dots connected
w
Indicating an under-range test
FIGURE 19
FIGURE 17
MODULUS
13
|
|
|
> |
|